Portland is a PR machine for light rail & streetcar
Here are Some Facts About Portland Oregon
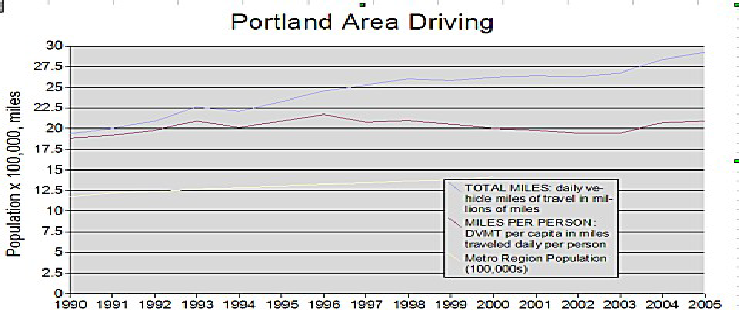
Metro: Portland Area Driving Increased
Both per capita driving and total driving increased
Here Are The Data Charts From Metro, Used for the Graph Above
Whole Portland Region Including
Vancouver, Wash
Portland only portion
|
Year |
TOTAL MILES: daily vehicle miles of travel in millions of miles |
MILES PER PERSON: DVMT per capita in miles traveled daily per person |
|
1990 |
19.4 |
18.8 |
|
1991 |
20.0 |
19.2 |
|
1992 |
20.9 |
19.8 |
|
1993 |
22.6 |
20.9 |
|
1994 |
22.1 |
20.1 |
|
1995 |
23.3 |
20.9 |
|
1996 |
24.6 |
21.7 |
|
1997 |
25.3 |
20.8 |
|
1998 |
26.0 |
21.0 |
|
1999 |
25.8 |
20.5 |
|
2000 |
26.2 |
20.0 |
|
2001 |
26.4 |
19.8 |
|
2002 |
26.3 |
19.5 |
|
2003 |
26.8 |
19.5 |
|
2004 |
28.4Â |
20.7 |
|
2005 |
29.2 |
20.9 |
|
Year |
TOTAL MILES: daily vehicle miles of travel in millions of miles |
MILES PER PERSON: DVMT per capita in miles traveled daily per person |
|
1990 |
22.4 |
18.7 |
|
1991 |
23.1 |
18.9 |
|
1992 |
25.3 |
20.2 |
|
1993 |
26.1 |
20.3 |
|
1994 |
26.5 |
20.2 |
|
1995 |
27.8 |
20.8 |
|
1996 |
29.3 |
21.6 |
|
1997 |
30.2 |
20.9 |
|
1998 |
31.1 |
21.1 |
|
1999 |
30.9 |
20.7 |
|
2000 |
31.5 |
20.3 |
|
2001 |
31.8 |
20.0 |
|
2002 |
31.8 |
19.8 |
|
2003 |
32.5 |
19.3 |
|
2004 |
34.2 |
20.2 |
|
2005 |
35.1 |
20.3 |