Portland is a PR machine for light rail & streetcar
Here are Some Facts About Portland Oregon
False Promises: High Density will Reduce Traffic Congestion
Here is The Usual Claim
Here is the rest of the story:
from The Sierra Club:
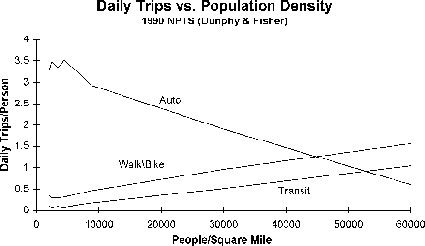
The data show that auto trips decline with increasing population density, as expected. These data indicate a near linear increase in public transit and walking-biking trips per capita with increases in population density above 4500 persons/square mile. Transit trips increase with density from a low of about 0.07 trips/capita below 4500 persons/square mile (about 4 households/residential acre in a residential-only zone) steadily up to 1.03 at the highest density of 60,000 (perhaps 100 hh/res ac in a mixed-use zone). Walking and bicycling trips also increase steadily with density above 4500 persons/square mile from 0.3 per person to 1.55 at the highest density aggregate.
- The panel to the left , from the Sierra Club, shows that increasing density decreases daily trips per person, but leaves out the fact that there are more total daily trips due to more people.That is how high density causes both less driving (per person) and more congestion (The decline in auto trips per capita, with increasing density, is smaller than the increase in density. A doubling in density leads to just a 10 percent decline in trips per capita. That means there will be 80 percent more trips per square mile.)
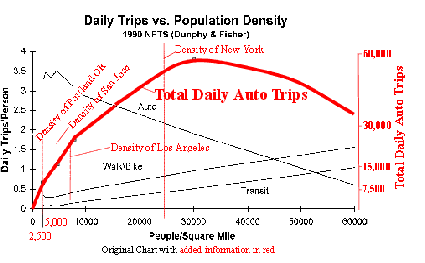
- The increase in the number of people causes the total number of Auto Trips trips to increase dramatically as shown by the red line we added to a copy of their graph below and by the Total Auto Trips column that we added to a copy of their table below.
- Total trips per area is a good measure of congestion: The congestion increases by a factor of almost TEN as we not quite cut the trips in 1/2 (3.28 trips per capita down to 1.9) because of the tremendous increase (15x) in population density required to cause this moderate decrease in driving.Download printable flyer of this concept.
Data Source:
Dunphy and Fisher ("Transportation, Congestion, and Density: New Insights," Transportation Research Record, No. 1552, Washington DC: Transportation Research Board, Nov. 1996, Table 5) aggregated the 1990 National Personal Transportation Survey (NPTS) by the population per square mile of the household?s ZIP code.
|
Per/Sq Mi |
Auto Trips/Cap |
Tr Trips/Cap |
Walk\Bike/Cap |
|
2000 |
3.28 |
0.08 |
0.33 |
|
2500 |
3.46 |
0.07 |
0.28 |
|
3500 |
3.34 |
0.08 |
0.29 |
|
4500 |
3.51 |
0.06 |
0.3 |
|
6250 |
3.29 |
0.11 |
0.36 |
|
8750 |
2.92 |
0.16 |
0.45 |
|
30000 |
1.9 |
0.5 |
0.95 |
|
60000 |
0.59 |
1.03 |
1.55 |
Density vs. Daily Trips, from Dunphy and Fisher
with Typical city and Total Auto trips added
|
Per/Sq Mi |
Typical Central City |
Auto Trips/Cap |
Total Auto Trips |
Tr Trips/C ap |
Walk\Bi ke/Cap |
|
2000 |
Indianapolis |
3.28 |
6,560 |
0.08 |
0.33 |
|
2500 |
Tucson |
3.46 |
8,650 |
0.07 |
0.28 |
|
3500 |
Portland |
3.34 |
11,690 |
0.08 |
0.29 |
|
4500 |
San Jose |
3.51 |
15,795 |
0.06 |
0.3 |
|
6250 |
Seattle |
3.29 |
20,562 |
0.11 |
0.36 |
|
8750 |
Providence |
2.92 |
25,550 |
0.16 |
0.45 |
|
30000 |
NYC=23k |
1.9 |
57,000 |
0.5 |
0.95 |
|
60000 |
2.5 x NYC |
0.59 |
35,400 |
1.03 |
1.55 |
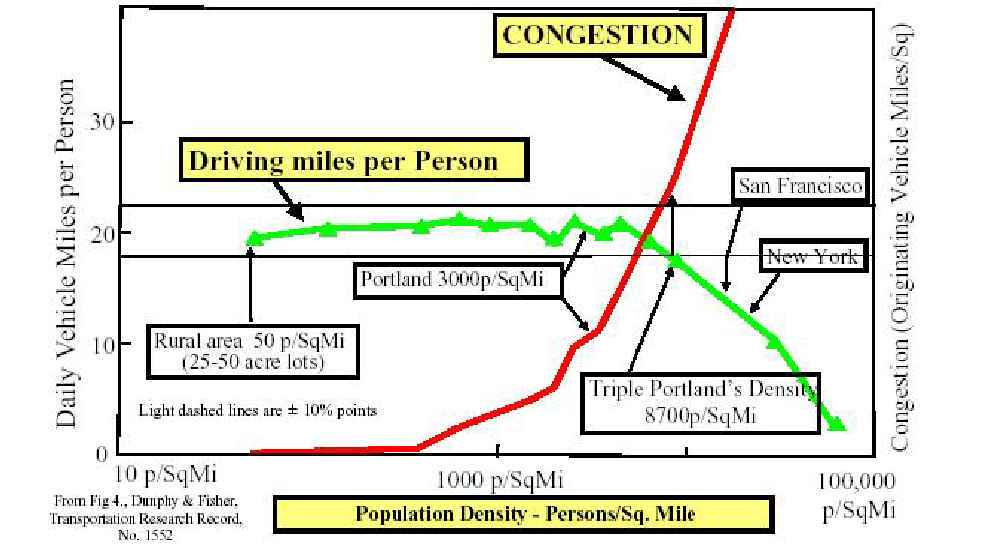
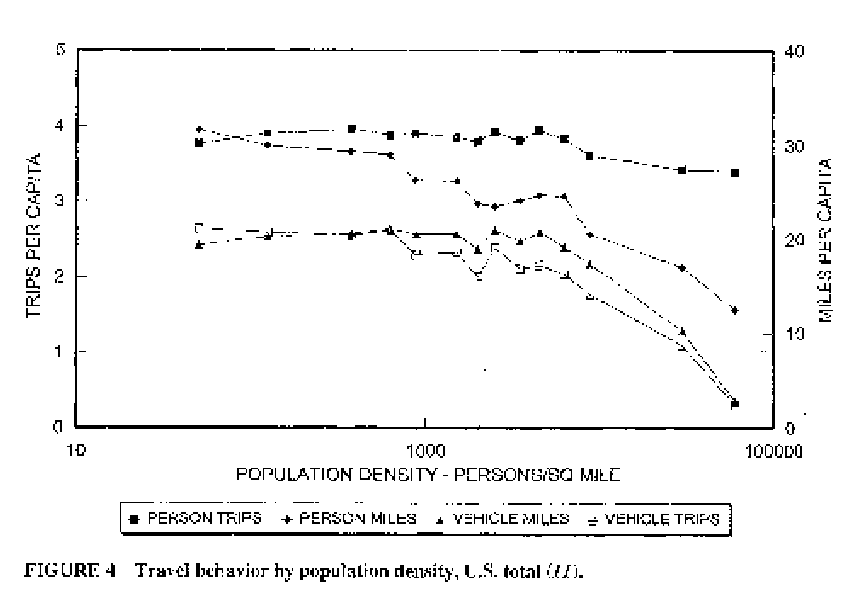
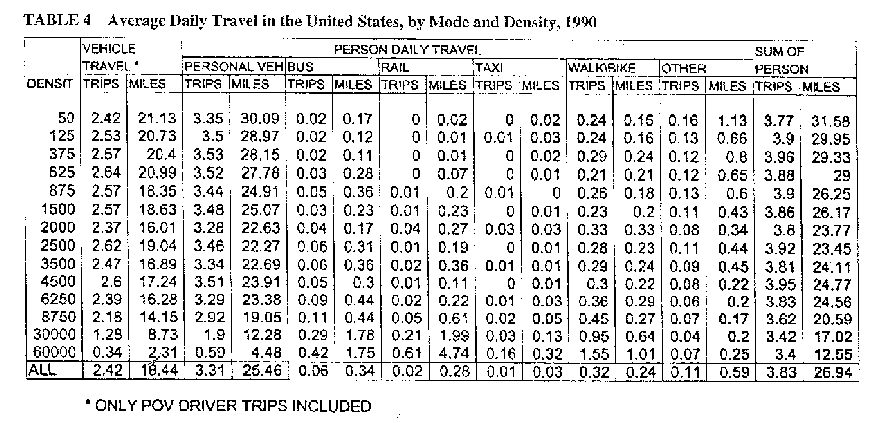
Here is the original Dunphy and Fisher FIG 4 and table 4. Notice the curve is much more gentle.That is because they chose a log display to more properly show the relationship between density and auto trips. You can plainly see that there are only three data points that show a useful reduction in driving! With so few data points, the conclusion is far from certain.
Density Increases Congestion
Driving DOES NOT Decrease Until You Triple Portland’s Density
Since driving per person stays about the same, congestion goes up with density:
more people = more cars = more congestion.